Anthropic has added three new artifact types to Claude: Whiteboards for visual canvases, Sheets for spreadsheets, and Data for dashboards and visual reports. All three are in beta and available on every paid plan, meaning Pro, Max, Team and Enterprise, across the Claude desktop app, the web app and the mobile apps. Testing them with real files shows where each one fits: a messy zip of analytics exports can become a planning board, a hand-maintained spreadsheet can move into Claude in seconds, and business metrics from an app Claude cannot reach directly can still land in a shareable dashboard through a bridge service.
Who gets the new artifacts and where to find them
Anthropic announced the rollout in a post on X. The new artifact types sit alongside the existing ones in the Artifacts tab in Claude's left sidebar, where the categories now read Docs, Slides, Sheets, Design, Data and Whiteboard. From that tab you can open artifacts you already made or start a new one of any type.
Two caveats apply. First, these are beta features, so the rollout may reach accounts progressively rather than all at once. Second, access requires a paid subscription; the announcement lists Pro, Max, Team and Enterprise as the eligible tiers.
| Artifact | What it is | Comparable tools |
|---|---|---|
| Claude Whiteboards | Visual canvas for diagrams, brainstorming and plotted data | Miro, Excalidraw |
| Claude Sheets | Native spreadsheet with formulas and imports | Google Sheets, Microsoft Excel |
| Claude Data | Dashboards and visual data stories, formerly Claude Dashboards | Business intelligence dashboards |
Claude Whiteboards: from a text prompt to an editable board
A whiteboard in Claude works like a visual canvas tool. You describe what you want, and Claude lays out cards, charts, sticky notes and connectors on a board you can then edit by hand or by prompt.
A first test with stock history
A simple test asked Claude to map out Tesla's stock performance over the past five years with key statistics and visual markers. Claude produced a multi-node board titled around the idea of a five-year roller coaster, with split-adjusted price points, milestone cards and color-coded boxes. The board marked price levels of $235, $352, $123 and $404, flagged a $410 all-time high in November 2021, showed a 65% drawdown in 2022, and noted rebounds of 102% in 2023 and 63% in 2024, for a 72% gain from the end of 2020 to the end of 2024. These figures are what the generated board displayed, not independent market data.
Every element stays editable. You can click into a card to change its text, resize blocks, and switch sticky note colors among options such as green, yellow, pink and blue. You can also keep prompting: a follow-up request to make the chart more interesting and add a zoomed-in graph underneath produced a second chart plotting 17 quarter-end closes with price labels, placed below the original in real time.
Sharing and export
The share menu offers two access modes, "Only people invited" and "Anyone with the link," plus email invitations for teammates. For teams already working elsewhere, a board can be exported as a PNG image or sent directly to Miro, Vani or Lucid. Every whiteboard also stays in your Artifacts library for later edits.
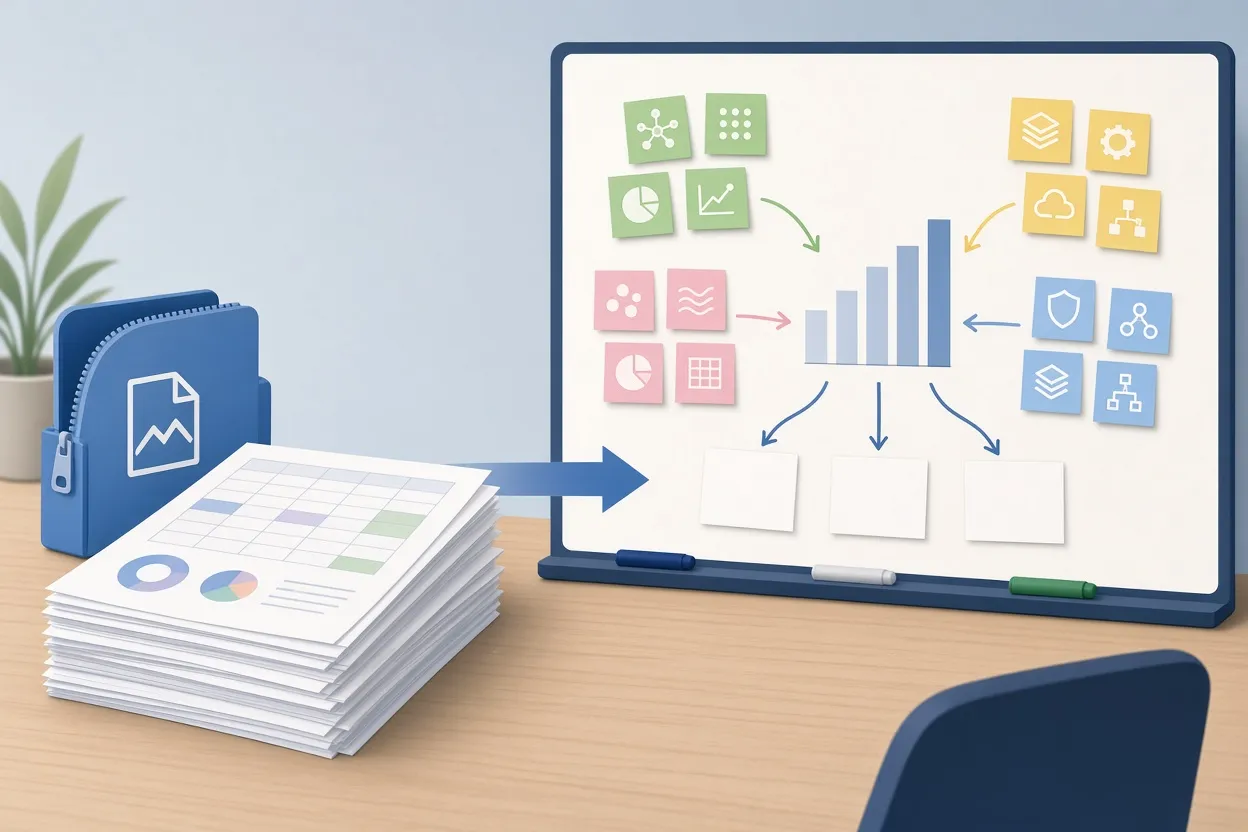
▲ Analytics CSVs reorganized into a content map
Turning a zip of CSVs into a content strategy board
The more revealing test used unstructured data. The input was a zip archive of YouTube analytics exports, several CSV files covering roughly a month of channel data. The prompt asked Claude to take the last 50 videos, group them into topic clusters as color-coded sticky notes, calculate average views and click-through rate (CTR, the share of people who saw a thumbnail and clicked it) for each cluster, identify spin-off topics from the top performers, and state what to stop making and what to test next.
Within seconds Claude produced a board titled as a content map of the last 50 videos. It contained clusters for topics such as deep dives on a chatbot product, Claude launches, AI news roundups and tool comparisons, each with its metrics, arrows branching from the strongest videos toward spin-off suggestions, and a set of idea cards for future videos.
What matters here is the workflow change. Synthesizing dozens of rows of tabular export data into a plan normally means manual sorting and judgment calls in a spreadsheet. Here the raw files went straight to a visual plan that a team can edit together, and the board persists in Artifacts so the plan can be revisited as new data arrives.
Claude Sheets: handing a maintained spreadsheet to Claude
Claude Sheets is a native spreadsheet environment inside Claude. Its layout and core functions mirror Google Sheets and Microsoft Excel: traditional formulas, automatic row and column formatting, and one-click importing.
Import paths
You can bring in data three ways:
- Upload a CSV file.
- Upload an Excel spreadsheet.
- Connect Google Drive through OAuth (a sign-in flow that grants Claude permission to read your files) and pick a Google Sheet directly.
The test used the third route. After clicking "Import from Google Sheets" and connecting a Google Drive account, the user selected a long-running "Following Tracker" sheet that logs daily follower counts on YouTube, Instagram and TikTok. Claude read the file and filled hundreds of cells across multiple columns in seconds, with no manual data entry.
Editing by description
Once the data is in, a "Describe a change" option lets you edit with plain language rather than formula syntax: recalculate a metric, change rows, or adjust a formula. The finished sheet can be shared by link like any other artifact. For anyone who has been maintaining a tracking sheet by hand, this is the route to move that work into Claude without reformatting the file.
Claude Data: dashboards, stories and connected apps
Claude Data is a rebrand and expansion of what was previously called Claude Dashboards, so it appears to be an evolution of an existing tool rather than a new one built from scratch. It now covers several output formats: Scrollyteller, Visual Short, Visual Analysis, and multi-widget Dashboards. Themes such as Clay, Ocean and Meadow give the output a consistent look, which is useful when the same team produces reports repeatedly.
Native connectors first
The cleanest way to feed Claude Data is a native connector. Under the Plugins tab, a Connectors list shows the apps Claude can sync with directly, so you can skip downloading CSVs and uploading them. Searching that list is the first step whenever you want live data in a dashboard.
When the app is not on the list
Not every business tool is in the native directory. The email marketing service Drip is one example. For those cases, the fallback is the Zapier MCP server. MCP, the Model Context Protocol, is a standard that lets an AI model call outside tools; Zapier's MCP server acts as a bridge that gives Claude access to more than 9,000 web applications through a single connection. You configure the server at Zapier, choose which apps and which actions Claude may use, and then call it from a Claude chat.

▲ Native connectors versus the Zapier MCP bridge
In the test, a Zapier MCP server already had Drip connected with triggers and actions for subscriber management. The prompt asked Claude to retrieve the account's statistics through that server and turn them into an analytical dashboard. Claude first asked which visual style to use; the Clay design system was chosen.
The resulting "Drip email stats" dashboard showed the following figures from that single account:
| Metric | Value |
|---|---|
| Total contacts on the list | 20,462 |
| Active subscribers | 15,814 (77.3% of contacts) |
| Unsubscribed contacts | 3,954 (19.3%) |
| Undeliverable contacts | 694 (3.4% bounce rate) |
| New subscribers in September | 1,101 |
| New subscribers so far in October and November | 544 |
| One-time broadcast emails sent, all time | 38 |
| Active automated workflows | 6 |
Interactive bar charts covered monthly subscriber growth, broadcast volume per month, workflow automations and subscriber tags. The dashboard can be shared through a private or public link, so a team can review current business data without anyone exporting a file or pasting numbers into a slide.
Which artifact fits which job
Based on these tests, the three tools divide fairly cleanly:
- Whiteboards suit planning and synthesis: turning a pile of export files or a loose brief into clusters, arrows and idea cards that a team can rearrange. They also serve as a quick way to visualize a dataset with context cards around it.
- Sheets suit ongoing tracking work you already keep in Google Sheets or Excel, where you want formulas and tabular structure but prefer to request changes in plain language.
- Data suits recurring reporting: subscriber counts, campaign volume and similar metrics presented as dashboards or narrated stories, ideally fed by a live connection rather than uploads.
Across all three, Anthropic has built sharing into the artifact itself, with invite-only or link-based access, which suggests the company is placing weight on team collaboration rather than single-user output.
Key points and next steps
Claude now offers three new artifact types, Whiteboards, Sheets and Data, in beta for Pro, Max, Team and Enterprise subscribers on desktop, web and mobile. Whiteboards converted a zip of 50 videos' worth of analytics CSVs into a content plan, Sheets pulled a multi-platform follower tracker from Google Drive and populated hundreds of cells, and Data produced a styled, shareable email marketing dashboard from a live account.
If you are on a paid plan, open the Artifacts tab in the left sidebar to see whether the new types have reached your account. Start with a file you already have: upload a CSV or zip to a Whiteboard and ask for clusters and recommendations, or import a spreadsheet you maintain by hand into Sheets and test the "Describe a change" option. For dashboards, check the Connectors list under Plugins first; if your app is missing, set up a Zapier MCP server and grant it only the tools you need. Export boards to PNG, Miro, Vani or Lucid when colleagues work elsewhere, and keep in mind that beta features may change as the rollout continues.