Ask an AI agent for total streams per record label, and it can confidently report a number nearly 2.5 times too high. The cause is often not hallucination, where a model makes up plausible but false content. It is duplicated rows created when a query joins several related tables. BigQuery Graph measures address this at the data model level: you define a calculation once, tie it to the entity it describes, and every query that uses it, whether a person or an AI agent wrote it, counts each item exactly once.
A wrong total that runs without errors
Consider a small catalog at a music company: five songs, the artists who perform them, two record labels, and four outside playlists that feature the songs. One label, call it Label A, owns four of the songs.
| Song | Streams | Playlists it appears on |
|---|---|---|
| Song 1 | 2.0 billion | 4 |
| Song 2 | 1.5 billion | 2 |
| Song 3 | 1.2 billion | 1 |
| Song 4 | 400 million | 1 |
| Total | 5.1 billion | - |
Added up by hand, Label A has 5.1 billion streams. Yet an analytics assistant built with Agent Development Kit (ADK), a toolkit for building AI agents, answers the same question with 12.6 billion.
The more dangerous part is that the underlying query raises no error. The SQL is valid, so the engine runs it without a warning. Across tables with millions of rows, nobody is likely to notice that the figure has been inflated, and users walk away trusting a number that is badly wrong.
How one song gets counted four times
The inflation comes from join fan-out, where a single row turns into several rows after a join. Following Song 1 through the query makes it clear:
- Before the join, Song 1 is one row in the songs table with 2.0 billion streams.
- Joining songs to playlist entries turns that row into four rows, one per playlist, and each keeps the full 2.0 billion value.
- Running SUM(streams) adds 2.0 billion four times, crediting Song 1 alone with 8.0 billion streams.
- Song 2 sits on two playlists, so its 1.5 billion becomes 3.0 billion.
- Songs 3 and 4 each appear on one playlist, so their 1.2 billion and 400 million stay correct.
Together that is 12.6 billion, about 2.5 times the real 5.1 billion. The same thing happens whenever you sum a column after joining across a one-to-many relationship, such as one song to many playlist entries, or a many-to-many relationship.

▲ Duplicated rows after a join
Putting the rule in the model, not the query
You could add deduplication logic to every query. Sooner or later, though, an analyst or an AI prompt will forget it. BigQuery Graph instead moves the rule into the data model so no one has to remember it. The setup has three parts:
- Source tables: your existing data in BigQuery or cloud storage buckets. Nothing is copied or physically transformed.
- Property graph: a layer that defines relationships over those tables. Songs, artists, labels and playlists become node tables, and the playlist entries become the edges that connect them.
- Measures: reusable aggregation rules written into the graph definition, for example MEASURE(SUM(streams)) AS total_streams on the songs node. Other entities can carry their own, such as MEASURE(SUM(marketing_budget)) AS total_budget on the labels node.
The key detail is that a measure is bound to the entity’s key. When the songs node declares KEY (song_id), BigQuery deduplicates automatically and counts each song once within whatever grouping a query asks for.
In SQL, you expand the graph with GRAPH_EXPAND and call AGG(Songs_total_streams) instead of SUM(streams). Run side by side over the same data, SUM returns 12.6 billion while AGG returns exactly 5.1 billion.
Define once, reuse across groupings
A measure does not need to be rewritten for each new question. Switch the GROUP BY and SELECT dimension from label name to playlist name, and the same AGG(Songs_total_streams) call correctly reports streams per playlist.
The AI agent benefits too. Asked the original natural-language question again, the assistant now returns 5.1 billion streams for Label A. The prompt did not change; the data model did.
What the total alone cannot show
Because the property graph keeps the full network, here 19 nodes and 22 edges, you can follow the paths behind a number rather than just read the number.
Ask how much of Label A’s 5.1 billion streams depends on any single playlist, and the graph answers that 4.7 billion, or 92 percent, flows through one playlist, the largest of the four with 35 million followers. That does not mean every one of those streams came from plays on that playlist. It means the label’s catalog is heavily exposed to a single distribution channel.
Cutting that playlist out of the graph makes the risk concrete:
- 3 of the label’s 8 playlist placements disappear.
- Song 3 is left with no playlist at all.
- The graph drops from 22 edges to 16.
A single scalar total hides this kind of structural dependency. Keeping the relationships that flat SQL joins collapse appears to give both analysts and AI agents the context they need to judge operational risk.
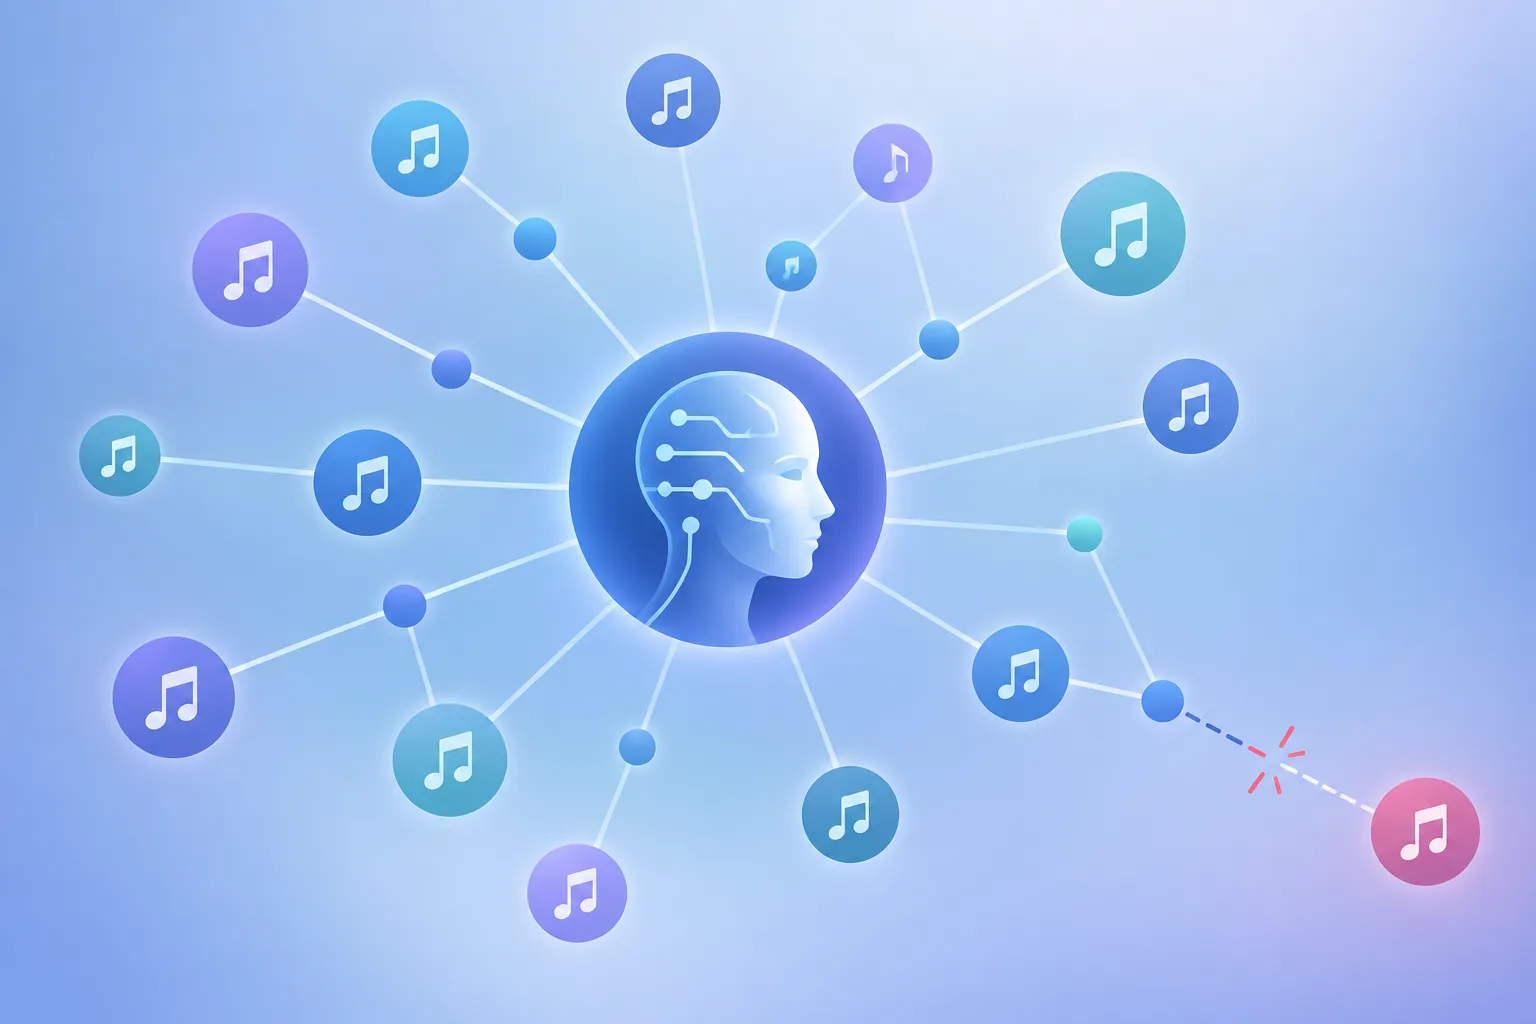
▲ Stream dependence on one playlist
Tools for building it
There are several ways to set up property graphs and measures:
| Option | What it does |
|---|---|
| BigQuery SQL | Define nodes, keys and measures with a CREATE OR REPLACE PROPERTY GRAPH statement |
| Visual modeler in BigQuery Studio | Build nodes, edges and measures visually and test measures without hand-writing DDL |
| Agent Development Kit | Connect BigQuery Graph to AI agents you build |
| Knowledge Catalog | Registers graph metadata and schemas automatically for discovery and governance |
BigQuery’s built-in conversational analytics agent, which answers data questions in plain language, can also query a property graph directly, so you do not have to build your own assistant first.
What to check before handing data to an agent
Wrong numbers from an AI agent may not be the model’s fault. Joins repeat rows and quietly inflate totals; measures stop that by tracking entity identity; and a measure defined once works in every query that follows. A practical starting point:
- Look for queries that sum a column after joining across a one-to-many relationship, such as songs to playlist entries.
- Move frequently used metrics into the property graph as measures and declare the node key.
- Have queries and agents call measures with AGG inside GRAPH_EXPAND instead of SUM.
- If writing DDL by hand is a barrier, use the visual modeler in BigQuery Studio to build the graph and test measures.
- Do not stop at the total. Use the graph to check whether results lean too heavily on a single channel.