A platform engineering startup that runs infrastructure for its customers uses AI agents to connect two jobs that often sit apart: investigating operational data and changing the infrastructure that produces it. An agent can search Elasticsearch logs, examine metrics and cluster configuration, then propose a fix through a pull request. The design aims to reduce observability costs without giving up the information engineers need to understand incidents, while keeping proposed changes subject to review.
Separate the data without separating the investigation
The company runs dedicated Kubernetes clusters for customers; Kubernetes manages containerized applications. Monitoring many isolated clusters with a bundled commercial service would cost the company an estimated $300,000 or more annually. That figure describes its own projected case, not a general savings estimate.
Instead, the company separates telemetry collection, storage, and visualization. Telemetry means operational signals such as logs and performance measurements. VictoriaMetrics stores metrics, while Elasticsearch provides searchable log storage. It uses vmagent for metric collection and Filebeat and Logstash for log aggregation; OpenTelemetry offers another collection option. Grafana supplies visualization and alerting. Across its cloud and internal environments, the company manages approximately 12 Elasticsearch clusters and a comparable number of VictoriaMetrics deployments.
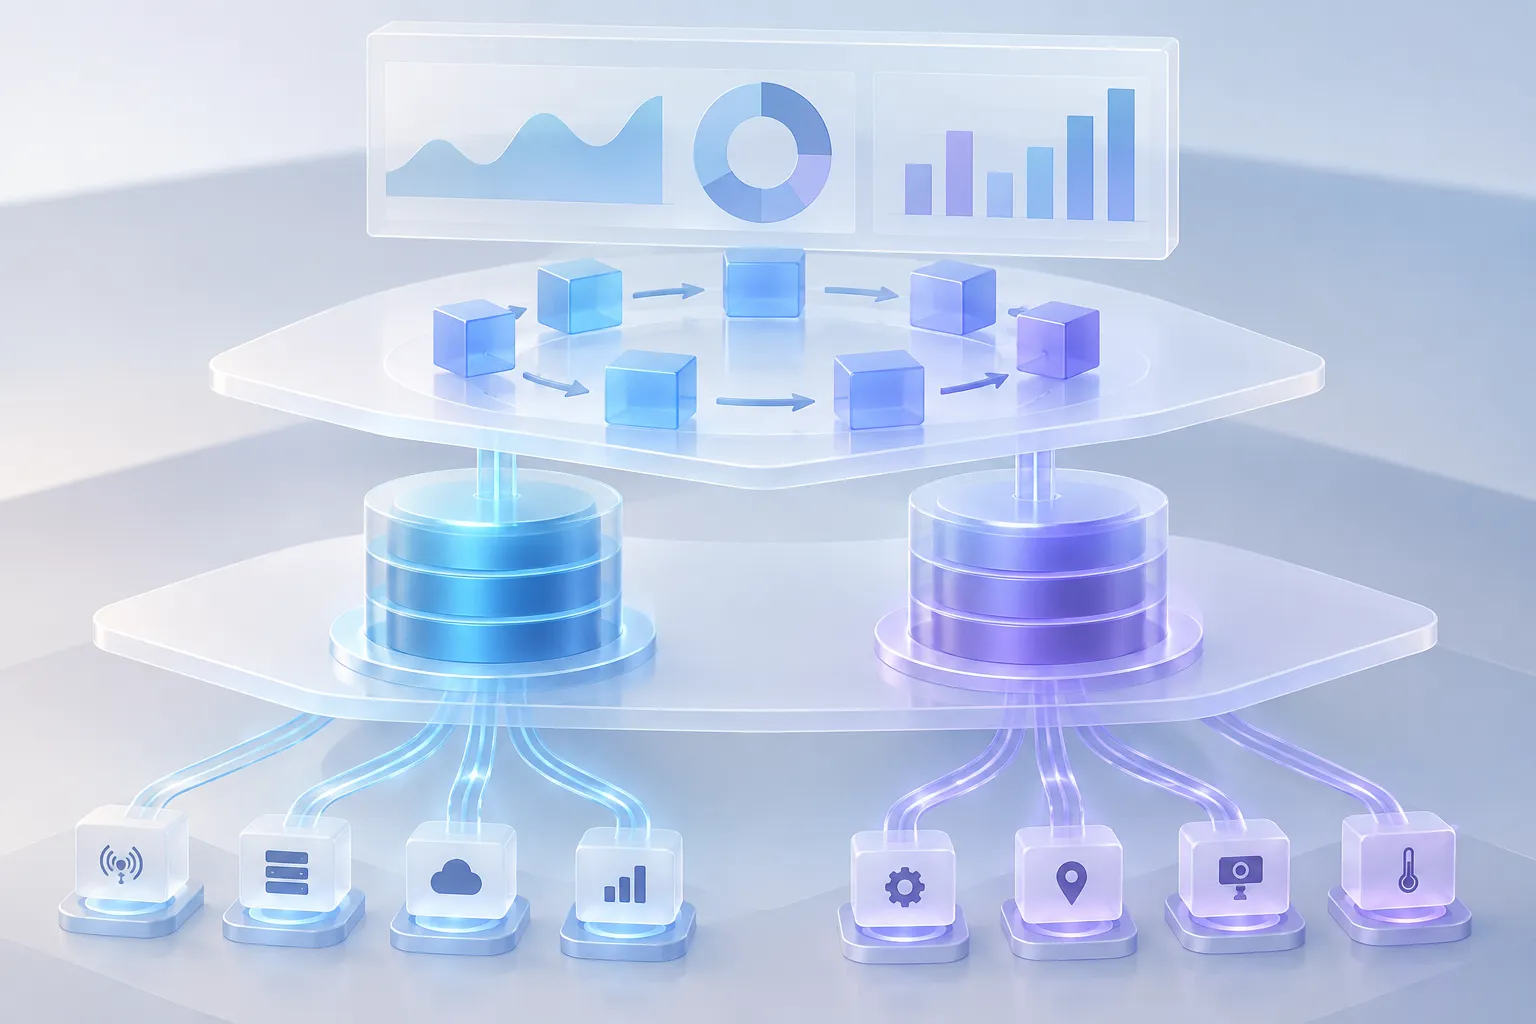
▲ Separate data stores and balanced indices
Separating these components does not make a dashboard unnecessary for every engineer. A less polished interface can make it harder for teams to use their data. Its approach is to let agents query the underlying stores and deliver findings, while retaining graphs that people can inspect. The potential cost advantage depends on preserving useful logs and metrics, not merely replacing a dashboard.
Make Elasticsearch predictable before an agent changes it
Elasticsearch needs a stable foundation for automated management. An index is a collection of searchable records, and a shard is a portion of that index distributed across the cluster. The company uses Index Lifecycle Management, or ILM, to roll logs into new indices before shards grow too large or old. One example policy rolls over at a maximum primary-shard size of 50GB or an index age of seven days, and deletes aged indices after 30 days. Those are policy settings in this case, not universal targets. Keeping shard sizes predictable helps avoid uneven loads and emergency reindexing.
For the cluster itself, the company uses Elastic Cloud on Kubernetes (ECK), an operator that automates Elasticsearch management. A Kubernetes Custom Resource Definition (CRD) describes node sets, storage, versions, and configuration in a form the operator can act on. ECK handles tasks including rolling upgrades, certificate generation, node scaling, and storage resizing.
The CRD also gives agents a defined place to propose changes. Under GitOps, infrastructure configuration lives in Git, where a pull request can record and review an edit before it is applied. This matters for a stateful datastore: adding nodes or restarting them can move shards and disrupt service. Simple, frequent threshold-based scaling is not a substitute for examining capacity and cluster state.
From capacity signals to a proposed storage change
The company’s agent workspace tool can run a scheduled cluster audit. In one workflow, a weekly job assigned separate observability and infrastructure agents to examine Elasticsearch capacity. The observability agent queried Prometheus metrics, including CPU use and available filesystem space, and displayed the resulting trends. The infrastructure agent inspected Kubernetes resources and the GitOps configuration. Together, those views let the agents compare what the cluster is doing with what its configuration requests.
The workflow follows four stages:
- Run a scheduled audit and collect metrics and cluster state.
- Compare capacity trends with the current Elasticsearch configuration.
- If a change is warranted, prepare a GitOps pull request.
- After approval and application, let ECK reconcile the updated cluster definition.

▲ Agent proposal awaiting human review
One result shows why a recommendation is different from an automatic edit. Although a chart showed declining free disk space, the agent initially decided that disk capacity and shard counts did not justify expansion, so it created no pull request. A later explicit instruction overrode that assessment. The agent then proposed increasing the requested storage from 500Gi to 550Gi on each of three Elasticsearch nodes, an aggregate increase of 150Gi, in a GitHub pull request. The change was a proposal prompted by the override, not evidence that the original assessment had called for expansion.
Use the same evidence path for incidents
The connection between logs and infrastructure also applies to application failures. For an alert about elevated HTTP 500 errors, an agent checked metrics and Kubernetes state, searched Elasticsearch logs, and inspected application code. It traced the errors to an intermittent exception in a FastAPI endpoint, then prepared a GitHub pull request with a code fix and regression tests. That investigation moved from a symptom to relevant logs and a proposed repair without requiring someone to assemble each query by hand.
Alerts can start these jobs through webhooks, and findings can be shared in a dedicated Slack incident channel. This expands the workflow beyond periodic cluster maintenance, but it does not remove the need to examine the evidence or review a proposed change.
Keep agent access narrower than its task list
The company runs coding agents in isolated pods inside the customer’s Kubernetes cluster, even when the orchestration service is cloud-hosted. The arrangement is intended to keep internal logs, telemetry, and credentials within the customer’s environment. Agent actions also inherit the requesting user’s identity and pass through a Kubernetes proxy that enforces role-based access control, or RBAC.
Some observability tools do not provide fine-grained permission checks for every metric. The company therefore uses Open Policy Agent (OPA) rules written in Rego, its policy language, to check individual tool calls. A rule can reject a call or require human approval. By default, reads can proceed autonomously, while writes require sign-off through a pull request or a platform prompt. Compliance frameworks such as SOC 2 also require human approval before code changes reach production.
What to take away
This approach links collection, searchable data, agent analysis, and cluster management rather than treating log search as the end of an investigation. Teams considering a similar workflow should first make index rollover and cluster configuration reliable, then give agents access to both telemetry and the relevant infrastructure definitions. Keep the evidence behind each recommendation visible, and require a person to review proposed writes before they reach production.