Anthropic says it made the main user flows in claude.ai and the Claude desktop app roughly three times faster in two weeks. According to an engineering write-up the company published on September 23, 2026, its engineers handed the performance work to Claude through a Slack channel and merged more than 3,000 changes without a single customer-facing incident or rollback. The model mattered, but the method mattered more: the team first decided exactly what to measure, then let an AI agent (an AI system that plans and carries out multi-step work on its own) push those numbers down, with humans holding the guardrails.
The two-week scorecard
Anthropic measured results at the 75th percentile of real user sessions. It focused on four journeys that together account for 95% of user activity: launching the app, starting a conversation, loading an existing conversation and sending a message.
| User journey | Before | After | Speedup |
|---|---|---|---|
| claude.ai web, fresh load to a typeable page | 3.1 s | 0.55 s | 5.6x |
| Claude desktop app, cold start | 6,310 ms | 3,328 ms | 1.9x |
| claude.ai web, start a conversation | 416 ms | 273 ms | 1.5x |
| Claude desktop, start a conversation | 945 ms | 451 ms | 2.1x |
| Claude Code, start a conversation | 837 ms | 347 ms | 2.4x |
| claude.ai web, load a conversation | 1,557 ms | 646 ms | 2.4x |
| Claude desktop, load a conversation | 1,353 ms | 488 ms | 2.8x |
| Claude Cowork, load a conversation | 2,586 ms | 728 ms | 3.5x |
| Claude Cowork, send a message | 928 ms | 48 ms | 19x |
| Claude Code on desktop, send a message | 250 ms | 52 ms | 4.8x |
The work ran through Claude Tag, a Slack bot powered by an internal research model roughly comparable to Opus 5.5. The team had planned a two-week sprint against 13 targets. It hit 12 of them by day three.
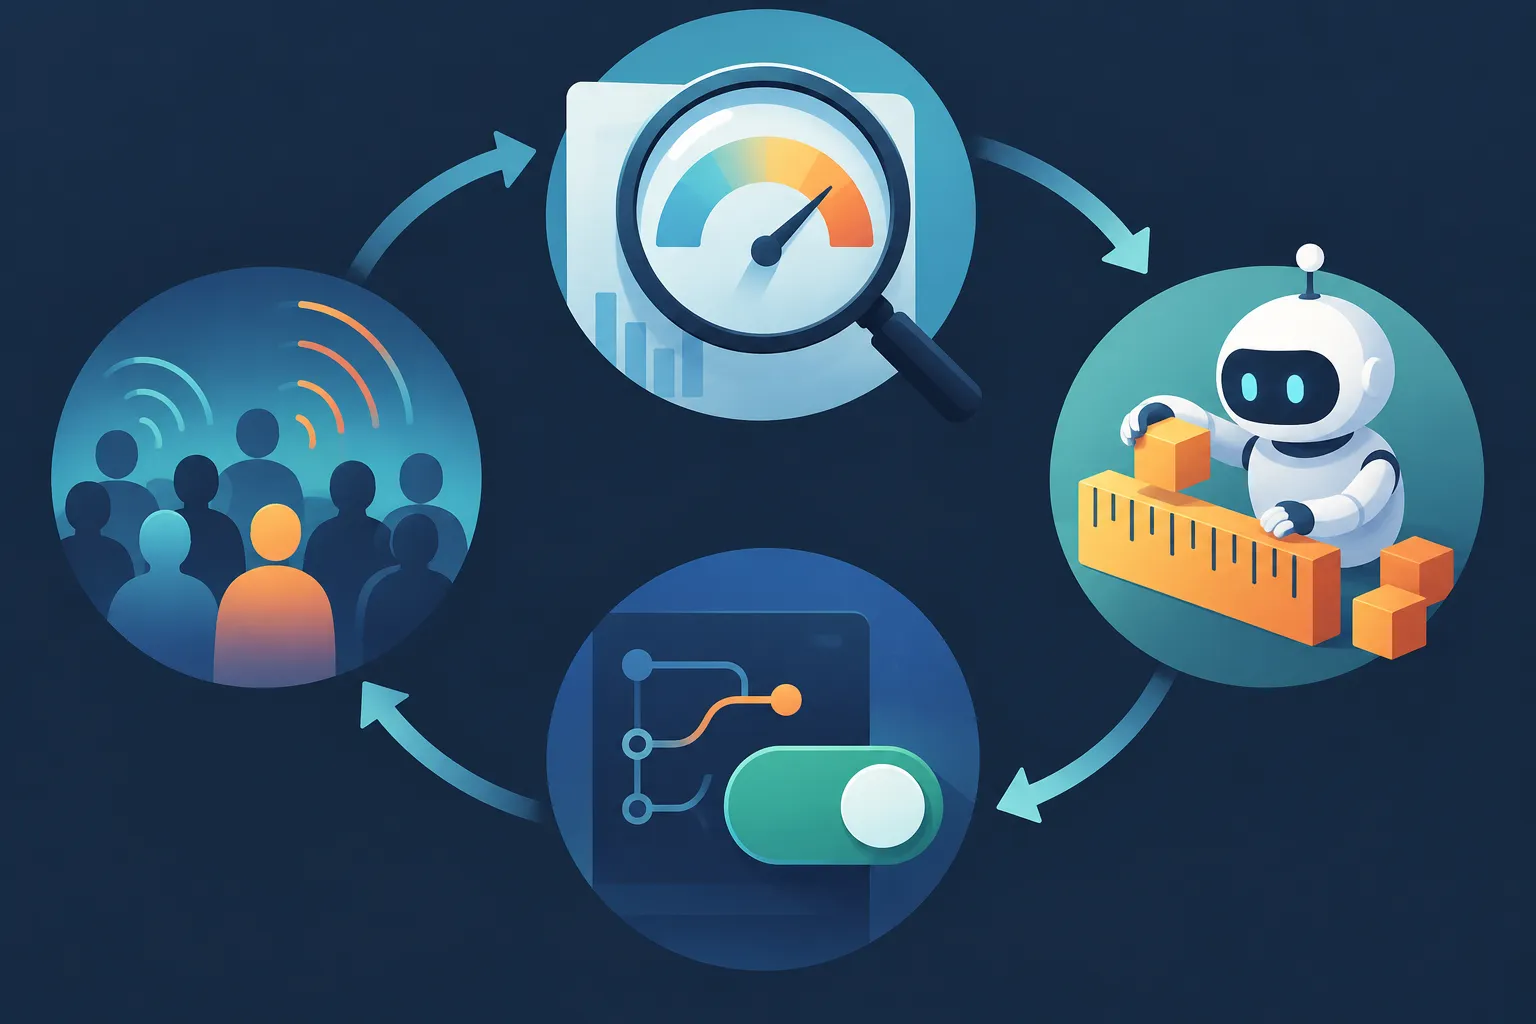
▲ Agent-driven performance optimization loop
Step one: measure what users actually feel
The team created a dedicated Slack channel with standing instructions. Claude was responsible for all performance work on claude.ai and the desktop app: watching deployments for regressions, checking whether telemetry was accurate, maintaining dashboards and proposing new initiatives. Connected to usage data through a Datadog MCP server (MCP is a standard way to plug tools and data sources into an AI model), Claude identified the four highest-impact journeys, which expanded into 13 measurable checkpoints across web and desktop.
The important choice was where each measurement starts and stops. Every checkpoint runs from the user’s action to the final render on screen, and it separates client time from server time. Many teams instead measure internal component updates, which is how a dashboard can report 200 ms while real users wait eight seconds. Getting this instrumentation right appears to be the prerequisite for handing optimization to an agent at all.
From there, the team picked 20 projects, and Claude predicted how many milliseconds each one would save. Those estimates rolled up into the sprint targets.
Step two: give the agent a number that does not wobble
Wall-clock time is noisy, which makes it a poor target for an agent that improves code in small steps. When an Anthropic engineer asked for an alternative, Claude suggested counting JavaScript instructions under Valgrind, a profiling tool, with Node.js running in its predictable mode. Compared against a baseline checked into the repository, that number has zero statistical noise.
Browsers do not allow that kind of instruction counting, so Claude proposed a ladder of deterministic proxies instead:
- React commits per interaction
- V8 function call counts from precise coverage
- Layout and style recalculations
- DOM mutations
Each benchmark had two jobs. In the lab it was a target for Claude to hill-climb, meaning improve step by step against a fixed score. In continuous integration (CI) it became a ratchet, a check that only lets the number go down. Claude also had to prove that gains on a proxy metric turned into real wall-clock speedups.
Two hot paths show what this looked like in practice:
| Hot path | Instructions | Wall-clock time | Speedup |
|---|---|---|---|
| Message-tree assembly | down 48% | down 76% | 4.6x |
| Status-line scanner in Claude Code | down 31% | down 44% | 1.8x |
In message-tree assembly, 25% of instructions went to slow dictionary lookups that resolved the same message ID three separate times.
What the agents found
The working loop was simple. An engineer reported a slow flow with a screen recording. Claude built a benchmark that reproduced it, opened pull requests behind feature flags, and checked field data after deployment. If real-world numbers improved, the benchmark ceiling was tightened. If not, the flag was turned off and Claude tried again.
In the second week, the team scaled this horizontally to more than 100 Claude threads, with up to 50 active at once. Some threads kept finding new work after their first task and produced 50 to 100 pull requests each. On peak days, more than 200 changes landed. One Anthropic engineer described the model as “a numbers demon.”
Among the problems the agents surfaced:
- Every keystroke in the message composer re-ran 6,900 React hooks and 900 store subscriptions.
- A single root-level CSS :has selector added 24 ms of style recalculation to every DOM change.
- A leftover page-reload call triggered about 500,000 hidden full page reloads per day.
- Idle background tabs cloned the same cache snapshot into IndexedDB, the browser’s built-in database, twice a minute on the main thread.
- An em-dash or curly quote in Markdown forced Chrome’s V8 engine to store the text in a slower two-byte format, so every syntax-highlighting regular expression ran on a slow path and the page froze for about a second. A 20-line change that copied code blocks into single-byte strings before highlighting fixed it.
Startup gains came from concrete changes. A static message composer was baked into the initial HTML so people can start typing before React finishes loading. The desktop app now ships a precompiled V8 code cache, so it no longer parses and compiles its scripts from scratch at launch. The composer stays mounted when users switch conversations, and conversations are prefetched when the pointer hovers over the sidebar, which cut sidebar re-renders by 90%.
A separate push targeted an 8.33 ms frame budget, the time available per frame at 120 frames per second. Claude got headless Chromium to step exactly 240 frames at that interval, then went through a long reply frame by frame. Memoizing finished text blocks and moving tokenization for growing code blocks into a web worker cut main-thread blocking during long replies from over 750 ms to about 200 ms, and CPU use fell by two-thirds. That single thread landed nearly 60 pull requests.
Where humans stayed in charge
Speed came with guardrails. Every pull request needed automated CI checks and at least one human approval. Risky changes shipped behind short-lived feature flags, close to 200 of them in two weeks, each removed once the change proved stable. The static composer was tested at 14 viewport sizes to confirm it matched the React version within one pixel, and simulated typing ran straight through the handoff to catch dropped keystrokes.
Tests still missed something. Four hours after the static composer went out internally, an employee sent a recording of the page jumping. The cause was a 56-pixel management footer that Chrome shows on the new tab page for enterprise-managed profiles. Chrome pre-renders a page while the address is being typed, at the size of the new tab page. When the footer disappeared about 100 ms later, the page resized, and the composer, which was positioned as a percentage from the top instead of anchored to the bottom, moved.
Direction was a human job too. By default, Claude scoped tasks narrowly and padded its time estimates. When it proposed a multi-day timeline for baseline telemetry, an engineer told it to be braver, and the estimate dropped to under an hour. After early targets were met, the team explicitly invited “wacky ideas” to get bolder proposals. In the other direction, reviewers rejected a 900-line pull request that saved 2 ms per message send, because it would have meant maintaining a custom build plugin. The team kept 150 threads narrowly focused on single benchmarks or journeys.
Taste stayed with people as well. Every thread had a human owner, and Claude showed user-visible changes with before-and-after recordings or screenshots. Whether tables should stream cell by cell or wait for whole rows, when to show skeleton loaders, and whether a word-by-word fade is worth 20% of a frame budget are judgment calls, not metrics.

▲ Cached sidebar out of sync with the server
The gaps that metrics miss
Hands-on use of the faster claude.ai suggests the speed has a cost. Sending a prompt and refreshing right away can make the new conversation vanish from the sidebar. Conversations deleted in another window can linger in the sidebar as cached entries, and clicking one returns an error saying the session is no longer available. The sidebar now renders instantly from a local IndexedDB cache, but it does not appear to revalidate against the server reliably. One alternative is to show cached data in a dimmed state until the server confirms it.
The broader lesson is that an agent chasing proxy metrics without context may switch off useful work such as prefetching or caching, because it scores better in isolation. Overly strict layout tests carry a similar risk: if the cache holds four items and the server returns five, a list that shifts down is correct behavior, not a bug. Users rarely report small stutters or slow sync, so engineers testing the product themselves remains essential.
How to apply this to your own work
The clearest takeaway is that giving an agent a concrete measurement turns an open-ended optimization problem into a solvable one. If you plan to hand performance work to a coding agent, this order follows what worked here:
- Instrument each key journey from user action to final render, separating client and server time.
- Give the agent deterministic targets such as instruction counts or React commits rather than raw timings.
- Confirm that proxy gains show up as real speedups, then lock them in with a CI ratchet.
- Ship risky changes behind feature flags and require a human approval on every pull request.
- Tell the agent explicitly when to think bigger, and reject complex changes that buy only tiny gains.
- Use the product yourself to catch sync problems and visual jank that no metric records.